To print logs from DigitalOcean Droplets, you can use the following command: “tail -f /var/log/file.log”. This command will display the contents of the log file in real-time.
DigitalOcean Droplets are virtual machines that provide scalable computing resources. When working with Droplets, it’s essential to have access to the log files for troubleshooting and monitoring purposes. Printing logs from Droplets can help identify errors, track system events, and analyze application performance.
By using the “tail” command with the appropriate file path, you can view the logs in real-time. This blog post will guide you on how to print logs from DigitalOcean Droplets, ensuring you have the necessary information to maintain and optimize your system. So, let’s dive in and learn the steps to effortlessly retrieve and print logs from your Droplets.

Credit: www.digitalocean.com
Introduction To Digitalocean Droplets And Logging
What Are Digitalocean Droplets?
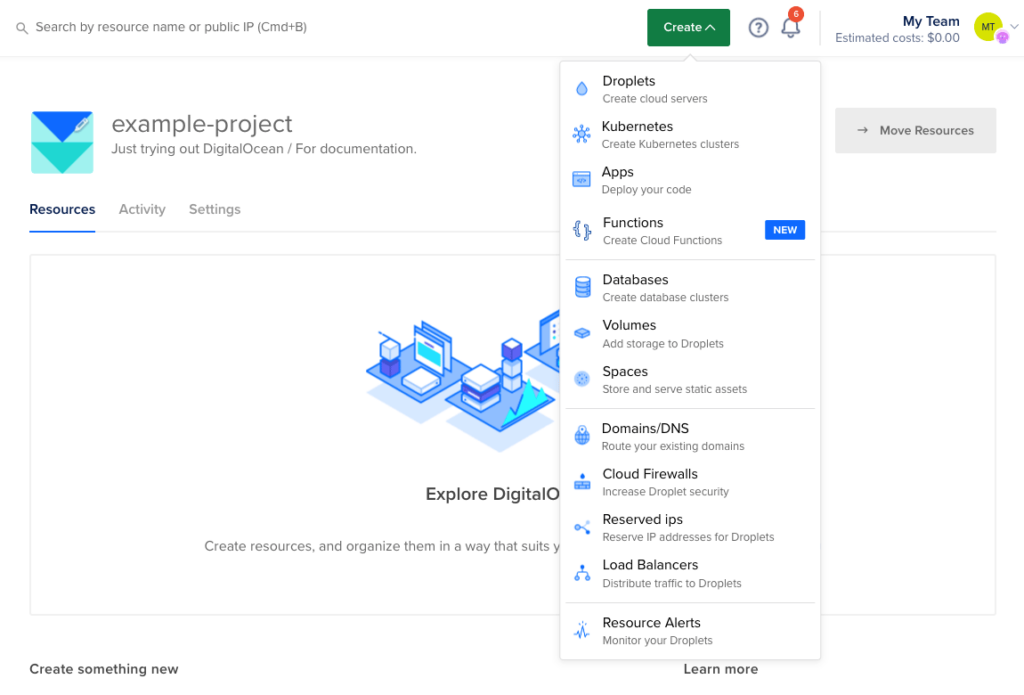
DigitalOcean Droplets are scalable virtual private servers that can be easily created and managed in the cloud.
They provide a cost-effective solution for hosting applications, websites, and databases.
Droplets offer various configurations to suit different needs, from basic web hosting to complex computing requirements.
Importance Of Log Management
Log management is crucial for monitoring system activities, troubleshooting errors, and ensuring security.
Proper log management helps in identifying performance issues and optimizing system resources.
It allows administrators to track user activities, detect anomalies, and maintain system integrity.

Credit: www.digitalocean.com
Setting Up Your Droplet For Logging
If you have a DigitalOcean droplet, you can enable logging to keep track of system events and troubleshoot any issues that arise. Here’s how to set up your droplet for logging:
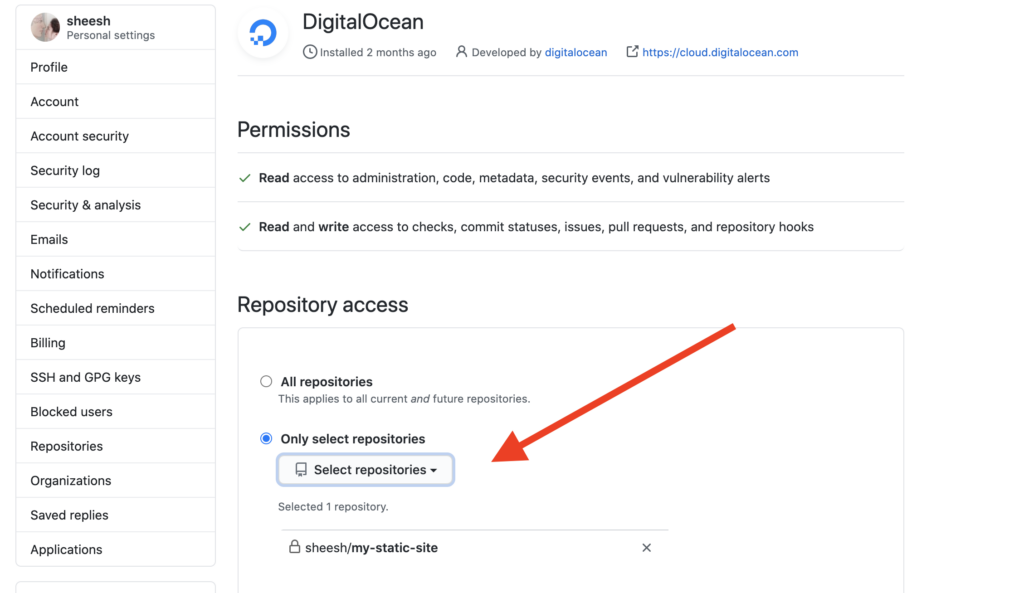
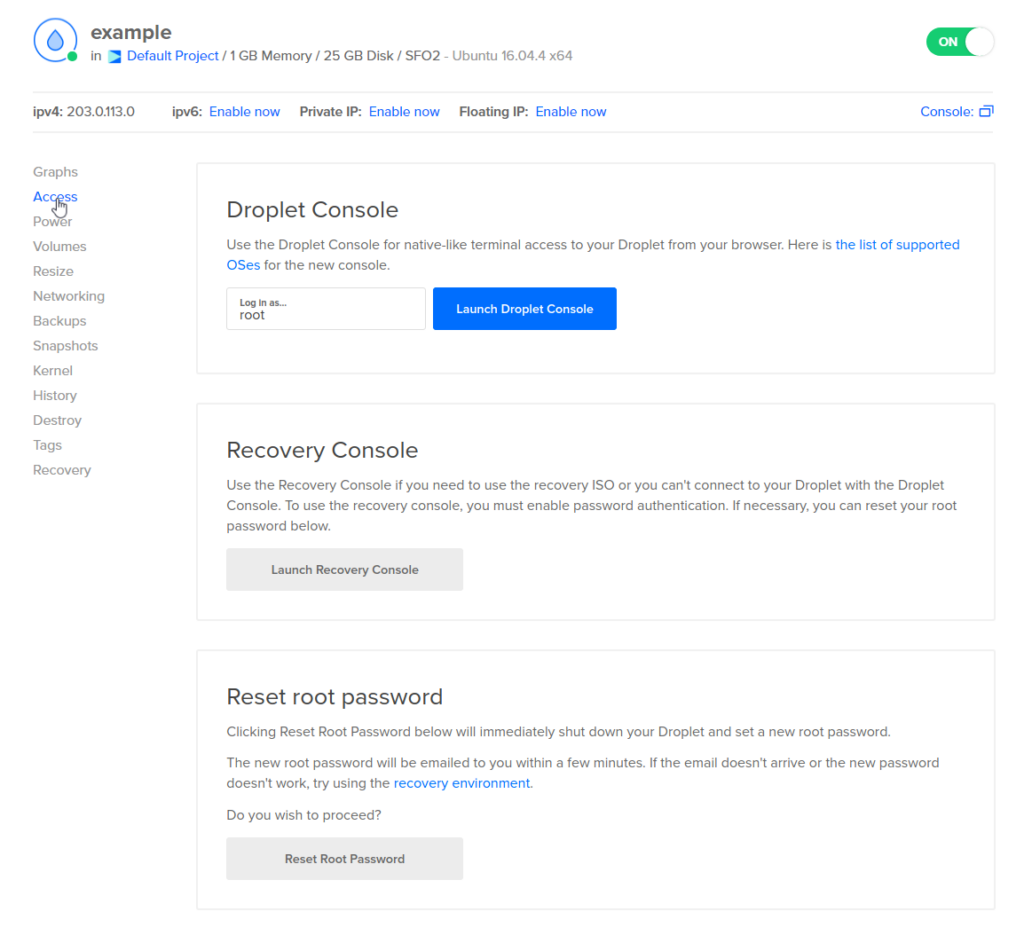
Accessing Your Droplet
To access your droplet, you will need to have SSH access. Once you have logged in, you can edit the configuration files to enable logging.
Configuring Log Files
The most important log file is /var/log/syslog, which contains system messages from all applications and services. You can also configure individual applications to log to their own files.
To configure log files, you can use a text editor to modify the configuration files. For example, to configure the syslog daemon, edit the /etc/rsyslog.conf file:
$ sudo nano /etc/rsyslog.conf
You can then add the following lines to the end of the file to log messages to a file:
# Log messages to file
. /var/log/myapp.log
Replace myapp.log with the name of the log file you want to create. You can also specify a directory, such as /var/log/myapp/, to store the log files in.
Once you have made your changes, save the file and restart the syslog daemon:
$ sudo service rsyslog restart
Now your application will log messages to the specified file.
Understanding Log Files In Linux
To print logs from DigitalOcean droplets in Linux, navigate to the log file directory and use the ‘cat’ command to display the log contents. You can also utilize the ‘tail’ command to print the last few lines of the log file, providing real-time updates on system activity.
Understanding Log Files in Linux Log files are crucial for monitoring and troubleshooting system activity on a Linux server. They contain valuable information about the operating system, applications, and security events. Understanding log files in Linux is essential for system administrators and developers to maintain the health and security of their systems.Common Log File Locations
In Linux, log files are typically stored in the /var/log directory. Here are some common log files and their purposes: – /var/log/syslog: General system activity logs. – /var/log/auth.log: Authentication logs including user logins and security-related events. – /var/log/nginx/access.log: Nginx web server access logs. – /var/log/mysql/error.log: MySQL database server error logs.Reading Logs With Command Line Tools
Linux provides powerful command-line tools for reading and analyzing log files: 1. tail: Display the last few lines of a log file. Example: `tail /var/log/syslog` 2. grep: Search for specific patterns or keywords in log files. Example: `grep “error” /var/log/auth.log` 3. less: View log files page by page. Example: `less /var/log/nginx/access.log` Understanding log files in Linux and utilizing command-line tools is essential for maintaining system health and identifying issues promptly.Using ‘tail’ To Monitor Logs In Real Time
Monitor logs in real time using the ‘tail’ command on DigitalOcean Droplets. Easily print logs and stay updated on system activity without the need for complex setups or additional tools. Stay on top of your logs effortlessly.
When it comes to managing your DigitalOcean Droplets, it’s important to be able to monitor your logs in real time. One of the most useful tools for doing this is the ‘tail’ command. In this article, we’ll look at how to use ‘tail’ to monitor logs in real time and some of the basic command usage.Basic ‘tail’ Command Usage
The basic ‘tail’ command is used to display the last few lines of a file. This is particularly useful for checking the end of a log file to see if there are any recent errors or issues. Here’s how to use the basic ‘tail’ command:- Open your terminal and log in to your Droplet.
- Navigate to the directory containing the log file you want to monitor.
- Type the following command:
tail [filename] - The last 10 lines of the file will be displayed in the terminal.
Following Logs With ‘tail -f’
If you want to monitor a log file in real time, you’ll need to use the ‘tail -f’ command. This will allow you to follow the log file as new entries are added. Here’s how to use ‘tail -f’:- Open your terminal and log in to your Droplet.
- Navigate to the directory containing the log file you want to monitor.
- Type the following command:
tail -f [filename] - The last few lines of the file will be displayed in the terminal.
- As new entries are added to the log file, they will be displayed in real time.
- To stop following the log file, press
Ctrl + C.
Leveraging ‘grep’ For Log Filtering
Filtering logs is an essential part of server administration. By leveraging ‘grep’, you can easily print logs from Digitalocean droplets. This helps to identify and troubleshoot issues faster, leading to better server management.
Filtering Logs With ‘grep’
When it comes to efficiently managing logs on your DigitalOcean Droplets, the ‘grep’ command is a powerful tool you can leverage to filter and extract specific information from your log files. ‘grep’ stands for Global Regular Expression Print, and it allows you to search for patterns or keywords within your logs, helping you quickly identify and analyze relevant data.
Using ‘grep’ is quite straightforward. Simply open your terminal and enter the following command:
grep "keyword" /path/to/log/fileReplace “keyword” with the specific term you want to search for and “/path/to/log/file” with the path to your log file. ‘grep’ will then display all the lines in the log file that contain the specified keyword.
Combining ‘grep’ With Other Commands
One of the advantages of ‘grep’ is its ability to work seamlessly with other commands, allowing you to perform more complex log filtering tasks. Here are a few examples:
-
Searching for a keyword in multiple log files: If you have multiple log files and want to search for a specific keyword across all of them, you can use the ‘grep’ command in combination with the ‘cat’ command and the pipe operator (‘|’). For example:
cat /path/to/log/files/ | grep "keyword"This command will concatenate all the log files together and then search for the keyword within the combined output. -
Filtering logs based on a specific time range: If you want to filter logs based on a specific time range, you can use ‘grep’ in combination with the ‘awk’ command. For example, to filter logs between two timestamps:
grep "keyword" /path/to/log/file | awk '/start_timestamp/,/end_timestamp/'Replace “start_timestamp” and “end_timestamp” with the desired time range. This command will extract and display the log lines that fall within the specified time range. -
Filtering logs by excluding certain keywords: If you want to exclude specific keywords from your log search results, you can use the ‘-v’ option with ‘grep’. For example:
grep -v "exclude_keyword" /path/to/log/fileThis command will display all the lines in the log file that do not contain the excluded keyword.
By combining ‘grep’ with other commands, you can enhance your log filtering capabilities and extract the precise information you need from your DigitalOcean Droplets’ logs. Experiment with different combinations to optimize your log analysis workflow.
Automating Log Management With ‘logrotate’
Setting Up ‘logrotate’
Log management is crucial for maintaining the health and security of your DigitalOcean droplets. One way to automate log management is by using ‘logrotate’, a system utility designed to simplify the administration of log files. Setting up ‘logrotate’ on your droplets is a simple yet effective way to ensure that log files are properly managed and preserved.
Customizing ‘logrotate’ Configuration
Once ‘logrotate’ is installed, you can customize its configuration to suit the specific needs of your droplets. Customizing the ‘logrotate’ configuration allows you to define the frequency of log rotations, the retention period for log files, and the actions to be taken after rotation. This level of customization ensures that your log files are managed in a way that aligns with your droplets’ requirements.
Exporting Logs For External Analysis
Exporting logs from your DigitalOcean Droplets allows you to analyze them externally for better insights and troubleshooting. By exporting logs, you can efficiently monitor and manage your server’s activity, ensuring optimal performance.
Installing And Configuring ‘rsyslog’
1. Install ‘rsyslog’ on your DigitalOcean Droplet using the package manager.
2. Configure ‘rsyslog’ to specify which logs to collect and where to store them.
3. Start the ‘rsyslog’ service to begin logging system data.
Forwarding Logs To A Central Server
1. Set up a central server to collect logs from multiple Droplets for centralized analysis.
2. Configure ‘rsyslog’ on each Droplet to forward logs to the central server.
3. Verify the log forwarding by checking the central server for incoming logs.
Troubleshooting Common Logging Issues
When facing logging issues on DigitalOcean Droplets, it is crucial to address them promptly. Let’s explore some common problems and solutions:
Diagnosing Missing Logs
If logs are missing, ensure the log files exist and have content.
- Check log file location and permissions.
- Review log rotation settings for file retention.
Resolving Permission-related Log Errors
Permission errors can prevent log writing. Here’s how to fix them:
- Grant appropriate permissions to log files and directories.
- Check user privileges for the log file location.
Best Practices For Log Management
When it comes to managing logs on DigitalOcean Droplets, following best practices for log management is crucial for maintaining security and compliance.
Regular Log Audits
Regularly reviewing logs helps identify issues promptly.
Maintaining Security And Compliance
Protect sensitive data by securing log access.
Conclusion And Additional Resources
Explore the step-by-step guide on printing logs from DigitalOcean droplets. Additionally, find additional resources to enhance your understanding and troubleshoot any issues you may encounter. These resources can further assist you in optimizing your logging process and effectively managing your droplets.
Summarizing Log Management Techniques
Proper log management is crucial for maintaining system health.
Use tools like rsyslog and Logrotate for efficient log handling.
Centralized logging simplifies log monitoring and analysis.
Further Reading And Tools
Explore these resources for enhancing your log management:
- Logstash for log parsing and data enrichment
- Elasticsearch for scalable log storage and search
- Kibana for visualizing log data and creating dashboards
Stay updated with the latest log management best practices.
Credit: www.reddit.com
Frequently Asked Questions
How To Check Logs In Digitalocean Droplet?
To check logs in DigitalOcean droplet, you can use the command “tail -f” followed by the log file path. This will display the latest log entries in real-time. Alternatively, you can use a log management tool like Papertrail or Loggly to aggregate and analyze logs from multiple droplets.
How Do I Access Digitalocean Droplet Files?
To access DigitalOcean droplet files, use the File Manager in the DigitalOcean Control Panel. Simply log in, navigate to the droplet, and access files easily.
How Do You Check The Logs For Your Application In The App Platform Dashboard?
To check logs for your application in the app platform dashboard, follow these steps: 1. Go to the app platform dashboard. 2. Look for the logs section or tab. 3. Click on it to access the logs. 4. You can then view and analyze the logs for your application.
How Do I Find The Id Of A Droplet In Digitalocean?
To find the ID of a droplet in DigitalOcean, log in to your account and navigate to the droplets section. Click on the droplet whose ID you want to find, and you will see the ID listed in the droplet details.
Conclusion
Learning how to print logs from DigitalOcean droplets is a valuable skill for any developer. With the step-by-step guide provided, you can easily troubleshoot issues, monitor system performance, and improve security. By utilizing this knowledge, you can optimize your digital infrastructure and streamline your development processes.
Start printing logs today and elevate your coding experience!